Evaluating and Categorizing Cloud Coverage Using K-Means Clustering on Sentinel-3 LST Data: A Case Study in Fujairah
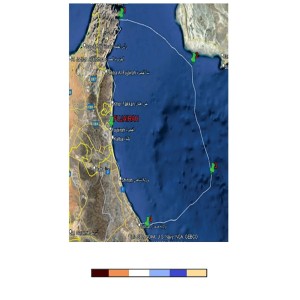
Clouds are fundamental to Earth's energy balance, climate, and weather patterns, acting as temperature regulators by either reflecting solar energy back into space or trapping thermal energy. Accurate assessment of cloud coverage is vital for weather forecasting and climate studies. Traditionally, cloud observation relied on subjective human perception, prone to inaccuracies. The advent of automated systems utilizing digital image processing and machine learning has revolutionized this field, offering more precise and consistent data.A research team at Fujairah Research Centre employed the K-means clustering algorithm to assess and classify cloud coverage using Sentinel-3 LST data in the Fujairah region. Their nine-month study, from January to October 2022, utilized data from the Copernicus satellite's Sentinel-3 LST F2 channel, providing a comprehensive view of cloud coverage within a 100-kilometer radius of Fujairah City on the Gulf of Oman.The Sentinel-3 mission is designed to measure sea surface topography, temperature, and color, supporting ocean forecasting, environmental monitoring, and climate research. Land Surface Temperature (LST) is a critical variable for understanding energy and water exchanges between the land surface, atmosphere, and plant growth. By analyzing LST data, the researchers could estimate cloud coverage and classify it into different types, including Null area with no data available, non-Cloud area ,rainy clouds, clouds with moisture, and dry clouds. Unlike hierarchical clustering methods, K-means is faster and capable of handling large datasets effectively, making it an ideal choice for this study. To enhance the algorithm's accuracy, the team implemented a standardized color bar alongside each image, ensuring consistent categorization of cloud types. The null area was characterized by a dark brown color, indicating the absence of available data. The region depicted in orange on the map represents a non-cloud area. A cloud exhibiting a blue hue indicates the presence of moisture, while dry clouds are represented by white. This approach not only mitigated the risk of misclassification but also provided a clear visual representation of the different cloud types, significantly improving the reliability of the cloud coverage analysis.The study found notable differences in cloud coverage over nine months. January and July had the most rainy clouds, with 92.7% and 47.20%, respectively, and the highest number of observations. February, May, June, and September had no rainy clouds. Moisture-rich clouds were most common in July (97.9%) and February (74%). Dry clouds were frequently observed, especially in January and July. Validation of the K-means clustering algorithm against human observations revealed impressive precision rates—over 99% for clear weather conditions and 95% for overcast conditions. This high accuracy underscores the effectiveness of integrating machine learning and digital image processing in cloud coverage assessment. The algorithm's ability to accurately identify and classify cloud types highlights its potential for enhancing weather forecasting and climate monitoring systems.
The study's findings emphasize the value of automated cloud observation systems. These advanced systems reduce reliance on subjective human observations, providing more consistent and reliable data. By incorporating machine learning techniques, researchers can extract critical information from image data, including temporal and meteorological parameters and statistical characteristics. This comprehensive data is crucial for understanding and predicting climatic patterns across various geographical locations, ultimately improving our ability to manage and respond to changes in weather and climate.In conclusion,the use of K-means clustering algorithm for Sentinel-3 LST data in the Fujairah region exemplifies how advanced data processing techniques can enhance our understanding of cloud dynamics. By providing precise and detailed classifications of cloud coverage, such methods contribute to more accurate weather forecasting models and climate studies. The study's methodology and findings can be applied to other regions and datasets, offering a robust framework for cloud coverage assessment. For more ref: Manar Ahmed Mohammed Alblooshi, Sirajul Huda Kalathingal, Shaher Bano Mirza, Fouad Lamghari Ridouane. (2023). Assessment and Classification of Cloud Coverage Using K-Means Clustering Algorithm for the Sentinel-3 LST Data: A Case Study in the Fujairah Region. American Journal of Remote Sensing, 11(2), 32-35. https://doi.org/10.11648/j.ajrs.20231102.11